Wealth, Race, and Higher Education: From Aspirations to Attainment
Published Nov 2025
Higher education is widely recognized as one of the most dependable pathways for upward mobility, providing benefits that extend throughout a graduate’s lifetime. But family wealth levels can make college access more or less of a reality for students. And the impact of family wealth differs across racial and ethnic lines.
Our latest analysis finds strong correlations between family wealth, race, and ethnicity across key milestones in students’ college journeys—college aspiration, persistence, and attainment. While most young adults aspire to attend college, translating these dreams into reality remains a significant challenge, particularly for students from under-resourced backgrounds. Students from wealthier families are more likely to aspire to college, and their aspirations are more likely to translate into college persistence and completion.
How is Wealth Measured?
Wealth reflects the total value of an individual or family’s economic assets and liabilities and offers a more complete view of a family’s financial resources than looking only at earnings and other income. Our analysis draws on two nationally representative datasets: one capturing students’ aspirations (the Panel Study of Income Dynamics Transition to Adulthood Supplement, PSID-TAS) and another measuring postsecondary stop outs and attainment (the Beginning Postsecondary Students Longitudinal Study, BPS). Students were categorized into wealth groups based on household net worth or reported assets, depending on the dataset.
For a full description of how students’ wealth and race or ethnicity were measured and categorized in each dataset, see the Additional Data and Methodology Notes below.
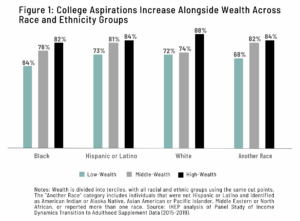
How Does Wealth Relate to College Aspiration Across Racial and Ethnic Groups?
Wealth shapes students’ college journeys from the very start. As family wealth increases, so do college aspirations, with some differences by race and ethnicity. Among students from low-wealth backgrounds, White and Hispanic or Latino students aspire to attend college at similar rates, while Black students’ aspirations are lower, likely due to prevailing structural barriers to higher education access. At middle wealth levels, Black and White students aspire to college at similar rates, and at high wealth levels, Black and Hispanic or Latino students show comparable aspirations.
These patterns highlight the importance of addressing inequities early in students’ educational journeys, through strategies such as targeted recruitment efforts that encourage more students to apply to and enroll in college, as well as need-based financial aid programs that alleviate affordability barriers to postsecondary enrollment and success.
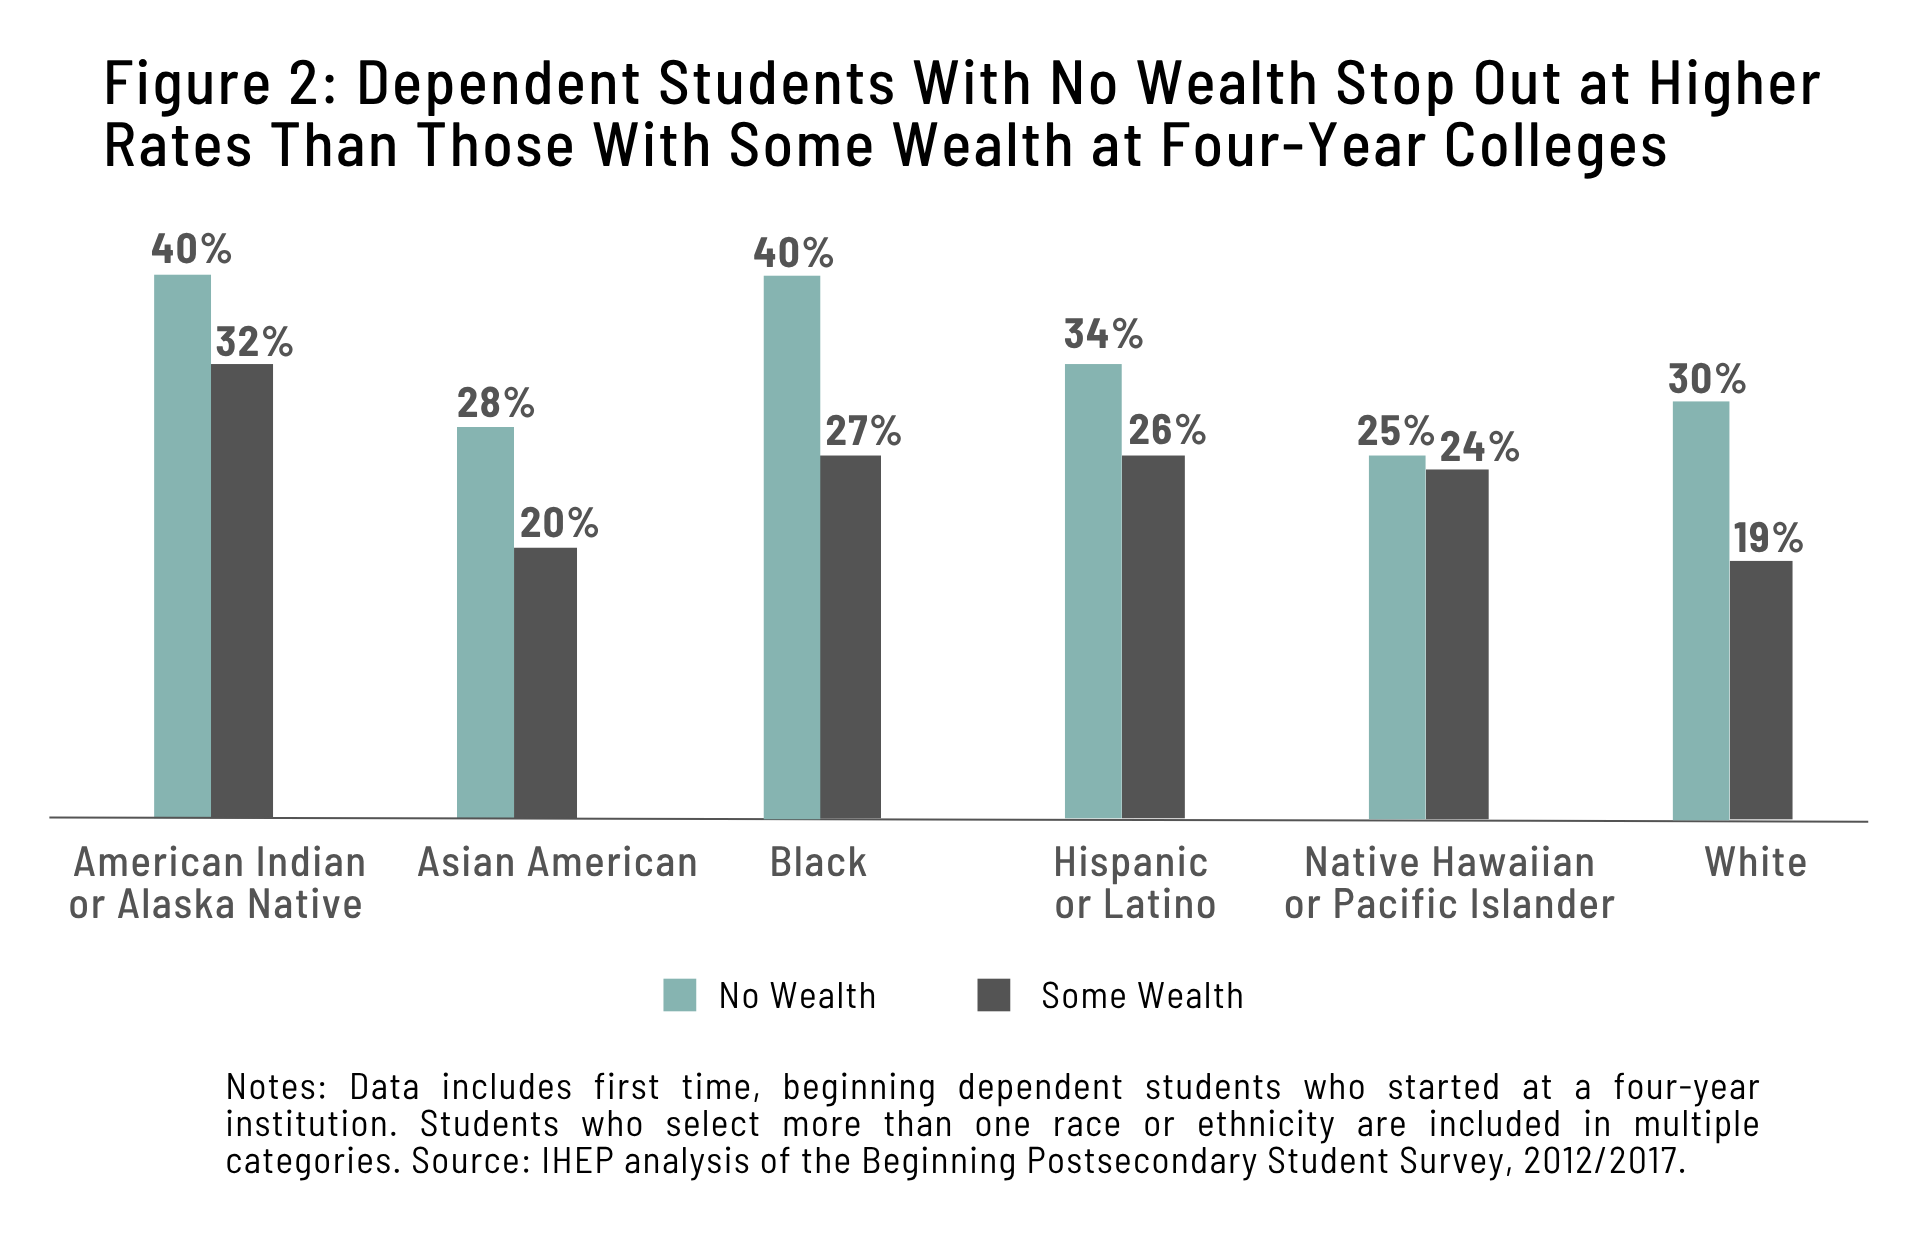
How Does Wealth Relate to College Stop Out Rates Across Racial and Ethnic Groups?
Students “stop out” when they leave college before completing a degree or credential. Stop outs are often triggered by financial, personal, work-related, or academic reasons. While some students re-enroll, many never return, leaving over 43 million adults with some college but no credential. These students invest substantial time and energy in their education but typically miss out on the earnings boost associated with earning a degree.
Among students starting at four-year colleges, stop out rates are higher for those with no wealth across all racial and ethnic groups. American Indian and Alaska Native (AI/AN) and Black students with no wealth have the highest stop out rates, with four in ten stopping out at least once within six years of starting school. Across wealth categories, White and Asian American students tend to stop out at lower rates. In fact, White and Asian American students with no wealth stop out at similar rates to AI/AN, Black, and Hispanic or Latino students with some wealth.
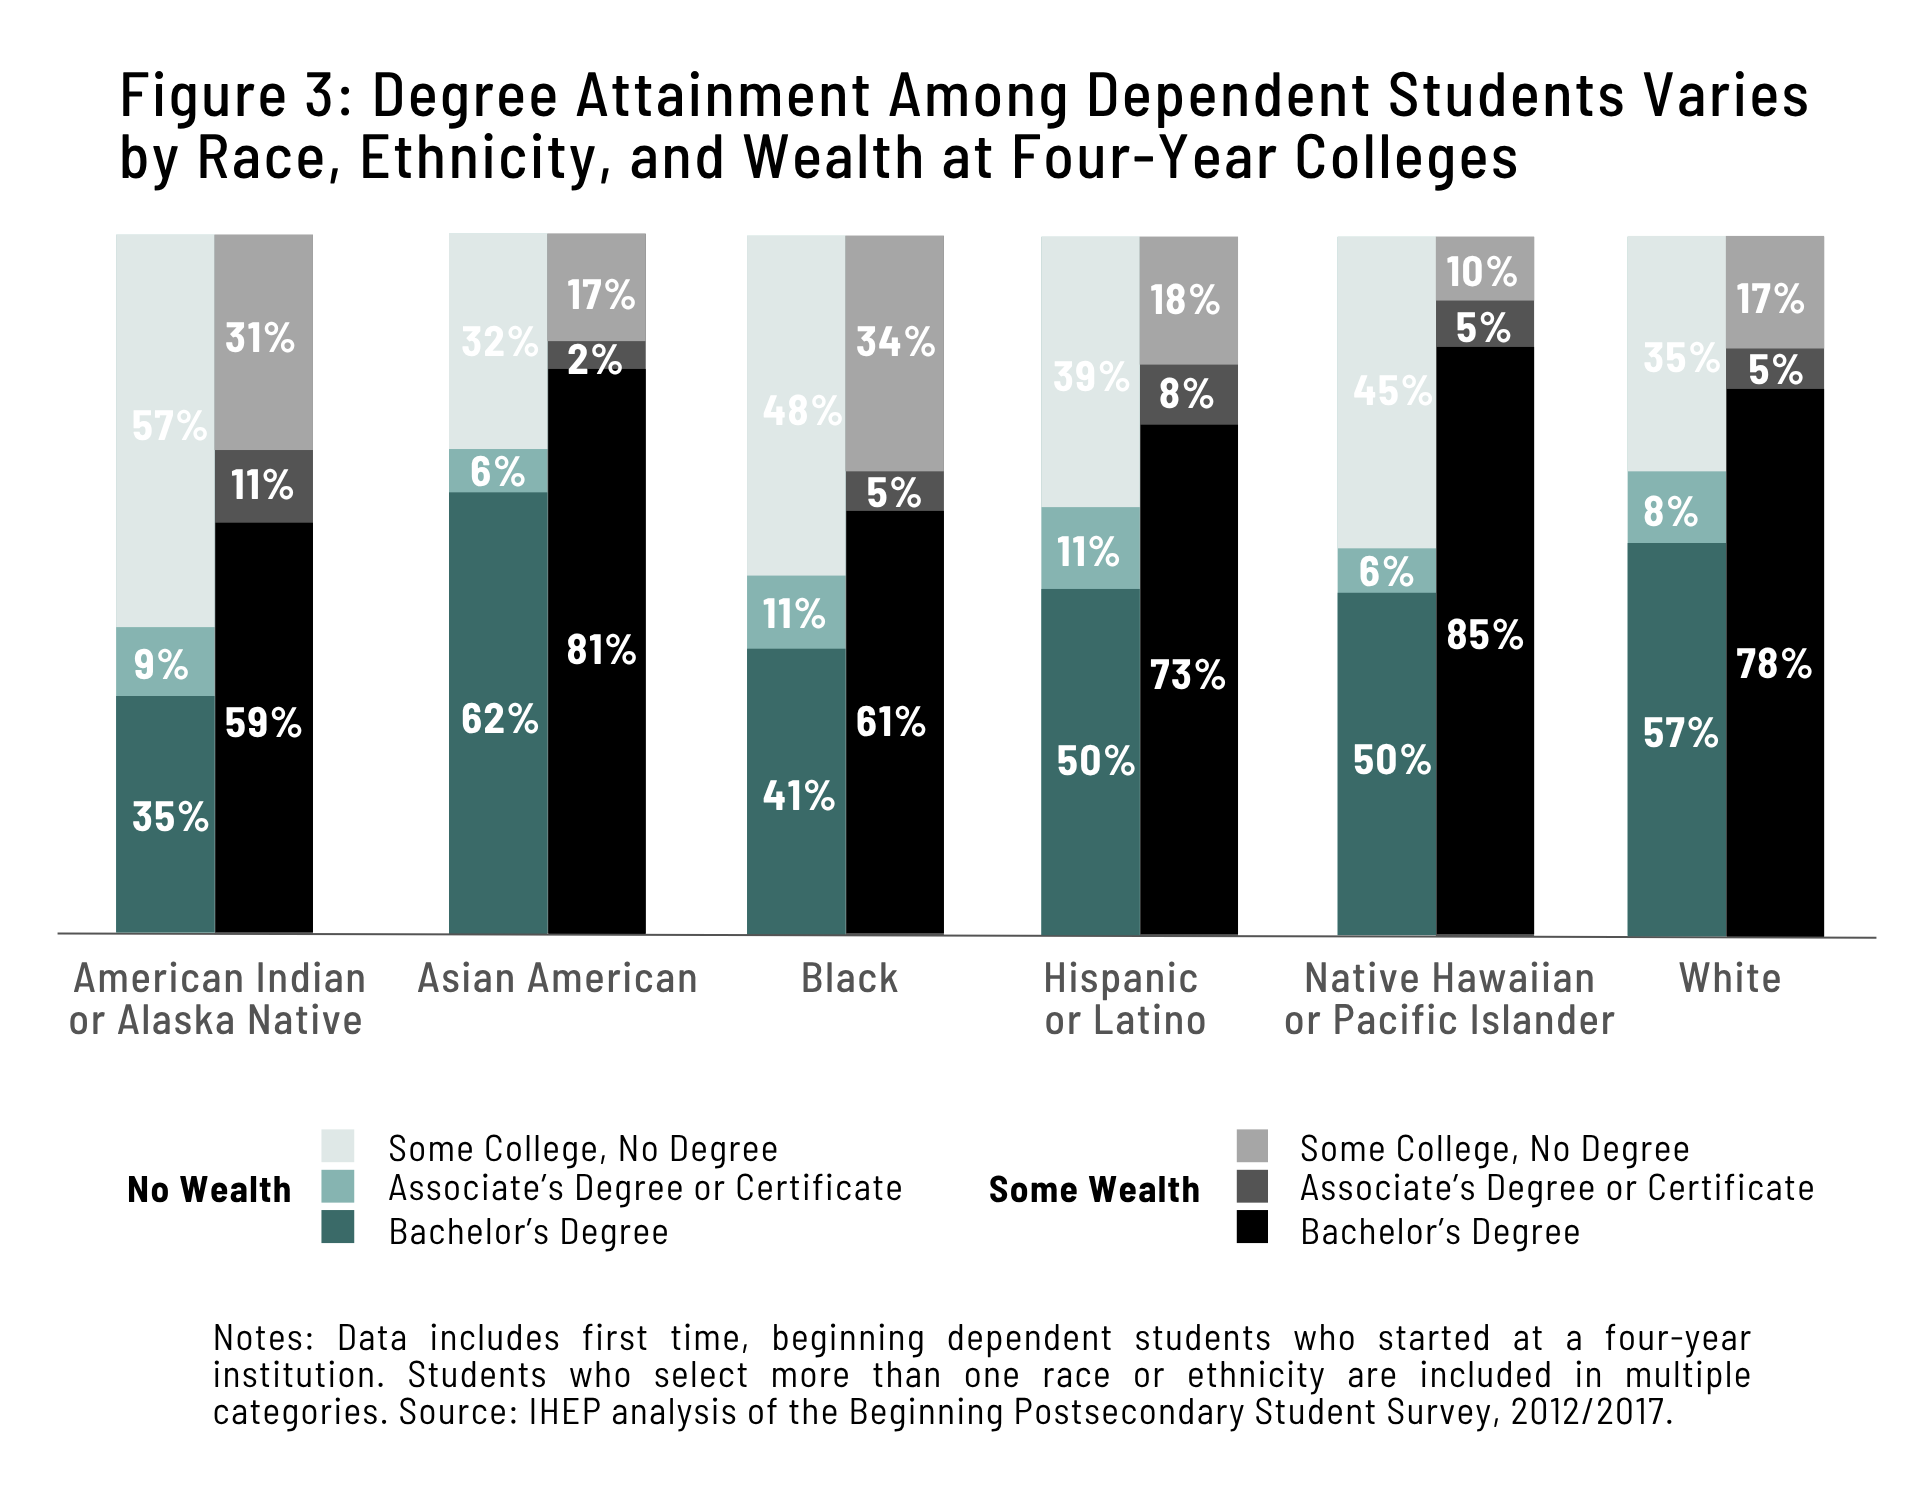
How Does Wealth Relate to College Attainment Rates Across Racial and Ethnic Groups?
Degree attainment determines who experiences the well-documented economic benefits of a college degree. As shown in Figure 3, across all racial or ethnic groups, students at four-year colleges with some wealth are more likely to earn bachelor’s degrees than those with no wealth. AI/AN students have the lowest bachelor’s attainment across both wealth categories, followed by Black and Hispanic or Latino students. White and Asian American students with no wealth earn bachelor’s degrees at rates similar to AI/AN and Black students with some wealth.
These patterns are reflected in ‘some college, no degree’ rates as well. Nearly six in ten AI/AN students with no wealth who begin at a four-year college leave without a credential, as do almost half of Black students. In comparison, rates are lower, though still concerning, for Asian American (32%) and White students (35%) with no wealth.
Turning College Dreams into College Degrees
Despite strong aspirations, levels of wealth shape students’ higher education journeys from enrollment to completion. Wealth disparities combined with barriers to postsecondary success contribute to higher stop out rates and lower attainment for under-resourced students.
Institutions, states, and the federal government should increase financial aid to students to help boost college affordability. Federal investments such as increasing the Pell Grant and state investments in first-dollar free college programs help students overcome financial barriers to enrollment and degree completion. Further, states should explore how to better support students from both low-income and low-wealth backgrounds, for example, by providing additional aid to those who face both financial challenges. In addition, institutions can improve student persistence and degree completion through providing robust wraparound services to students, such as childcare and transportation support, holistic advising and tutoring services, emergency aid programs, and mental health services.
By considering wealth alongside income in policy design and investing in comprehensive student supports, higher education can be a pathway to opportunity rather than a reflection of existing inequality.
Explore our full Wealth, Race, and Higher Education series to learn more.
Additional Data and Methodology Notes
The Panel Study of Income Dynamics (PSID)
We use the Panel Study of Income Dynamics Transition to Adulthood Supplement (PSID-TAS) to understand how college aspirations vary with students’ race and ethnicity and family wealth background.
The PSID is a nationally representative longitudinal survey of American households. PSID data used in this analysis are drawn from two elements of the study: (1) the main study, and (2) the Transition into Adulthood Supplement (PSID-TAS), which provides information on young adults, ages 18 to 28, from households in the main study. The PSID-TAS sample is comprised of all respondents who participated in least one year of the survey between 2005 and 2019.
Respondents are categorized into terciles of wealth based on their household net worth for each survey year. The same cut points are applied to all racial and ethnic groups.
PSID-TAS respondents can report up to five racial categories. To create an overall race or ethnicity indicator, each individual’s responses were aggregated across all waves in which they participated, to derive the following categorizations:
- Hispanic or Latino if they ever reported their ethnicity as Latino and/or Hispanic.
- Black if they only report their race as Black.
- White if they only report their race as White.
- Another race if they were not Hispanic or Latino, and identified as American Indian or Alaska Native, Asian American or Pacific Islander, Middle Eastern or North African, or reported more than one race.
Beginning Postsecondary Students Longitudinal Study (BPS)
We use the Beginning Postsecondary Students Longitudinal Study (BPS:12/17) to measure stop outs and attainment and students’ race and ethnicity and asset information.
BPS is a longitudinal study that tracks first-time students’ pathway through postsecondary education. Students are surveyed during their first year of postsecondary education and again three and six years post their initial enrollment.
Wealth categories derived from BPS data were aggregated as follows:
- No wealth presumed: Students who are not required to report assets on the Free Application for Federal Student Aid (FAFSA), or those whose assets are less than the asset protection allowance.
- Some wealth presumed: Assets reported on FAFSA exceed the value of the asset protection allowance.
Race and ethnicity categories are based on binary variables. Students who identify with more than one race or ethnicity are counted in each relevant category rather than grouping all multiracial or multiethnic students in a “two or more races” category. This inclusive approach improves the precision of estimates for racial and ethnic groups, due to larger sample sizes, and better allows for the inclusion of underrepresented groups in research findings.
Acknowledgements
We would like to thank the individuals and organizations who helped develop this brief, including Charles Sanchez, former research analyst, who provided data analysis for the PSID figures used in this brief. We’d also like to thank Mamie Voight, IHEP president; Erin Dunlop Velez, vice president of research; Diane Cheng, vice president of policy; Kelly Leon, vice president of communications & government affairs; Lauren Bell, communications manager.
All ideas, findings, and conclusions drawn by this brief are the sole responsibility of the authors.